We cannot emphasize enough the importance of Technical Analysis, as a valuable tool in your quest to become a veteran trader. A major portion of your initial education must entail studying this topic until it becomes very familiar, the one true friend that you will lean on in the markets. Technical Indicators can detect short-term pricing trends and help you gain insights and predict future price movements. Although most indicators use complicated math and statistics to arrive at their conclusions, trading platform software will do the work for you. It is then your job to interpret the results and go from there. These tools are not perfect, but they will increase your probability for winning trades.
Let’s start with the following Metatrader4 (MT4) chart from the forex-trading world to drive home a few key points about trends, support and resistance, and indicators:
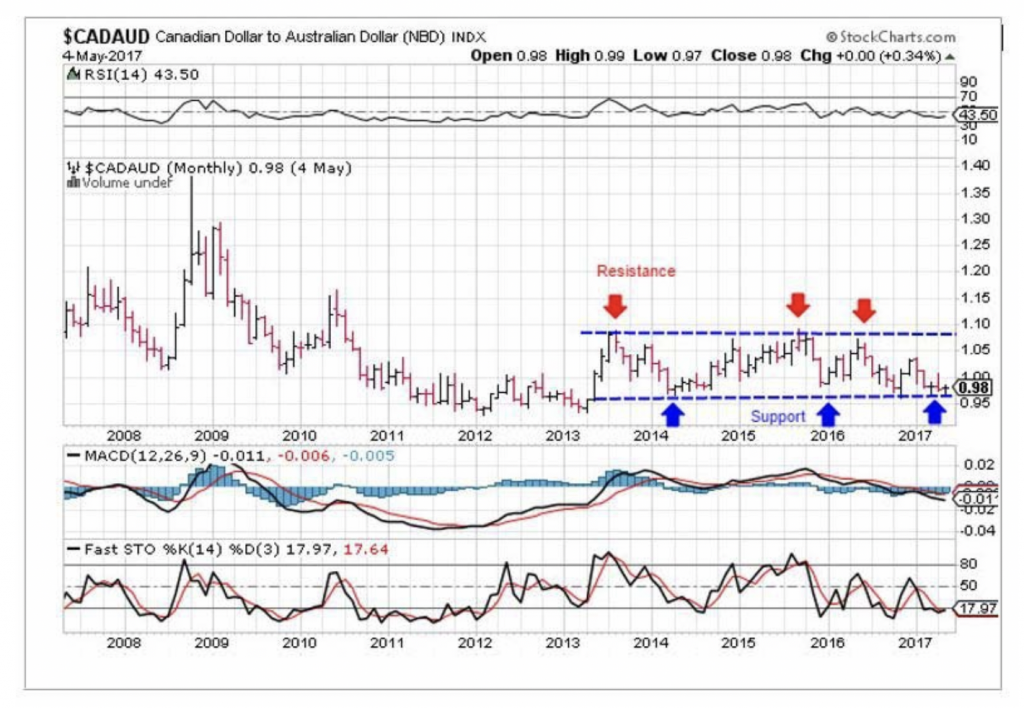
The “timeframe” of this chart is monthly, a rather long time period, but one of the primary strengths of technical analysis is its flexibility. It can be used across markets, and more importantly, across different timeframes. What applies here will also apply to Daily, 1-Hour, or even 5-Minute charts. Monthly pricing information can be gleaned from the “Bars” shown, although “Candlesticks” are also in fashion. One “Bar” depicts Open, Closing, and Range of prices for the period. It would also behoove you to spend your time studying Candlestick formations, as well. They contain a wealth of information that a trader can quickly assimilate into a trading strategy on the spot.
The first half of the chart depicts a downward trend, while the right half illustrates ranging behaviour. Studies have shown that markets tend to range between rigid boundaries roughly 70% of the time. Trending behaviour accounts for the remainder. The blue-dashed lines in the chart were added to show these “rigid boundaries”, which are known as Resistance and Support. We could just as easily have drawn diagonal lines about the trending action on the left, as well. Your entry point will typically be when prices “bounce” off one of these lines, but the real “trick”, if there is one, is to wait for the breakout trend that materially penetrates one of these lines, and then ride the wave, so to speak.
The objective of most technical indicators is to pinpoint optimal entry and exit points in a market. Three of the most popular indicators are presented in the above chart: The Relative Strength Indicator (RSI), Moving Average Convergence-Divergence (MACD), and Fast Stochastic (STO). Each attempt to portray when the market is overbought or oversold, thereby suggesting that a change in direction is imminent, and each is often used to confirm the signals provided by another.
The RSI, for example, is a momentum oscillator used to measure the relative changes between the higher and lower closing prices to determine the velocity and magnitude of directional price movements. The RSI is plotted on a zero to 100 scale, and 70 and 30 values are used as warning signals suggesting overbought and oversold conditions, respectively. The RSI is a leading indicator and works well in trending markets to signal that a change in direction of the trend is imminent, but it is also generally ineffective in ranging markets. The MACD is a lagging indicator, but it is often used in tandem with the RSI in order to detect and confirm trends in price behaviour.
Demo systems provide an excellent environment to test indicators and then use them in developing your personal trading strategy. The general advice is to use no more than 2 to 3 indicators on one chart to prevent what is called “indicator overload”. The overall effectiveness of indicators, however, is tied to the length of the timeframe, the volume of pricing data available in that timeframe, and the volatility, or lack thereof, of the market. Market conditions change day to day, or even more quickly, which means that strategies must also adapt. As the old saying goes, “Take what the market gives you!”
There is an additional word of warning when it comes to relying too heavily on indicators and the signals they suggest. It is very easy to fall into a trap of trying to predict tops and bottoms in pricing behaviour. Veteran traders will bend your ears for hours relating their tales of woe and the scars they have earned from making this crucial mistake. It is a lesson that sometimes must be learned the hard way, but the odds are heavily weighted against you if you wish to try. The best advice is to confirm a trend, jump on it, and then ride it to victory.