If there is one lesson that a newcomer to crypto trading discovers, then it has to be that prices in this ecosphere are extremely volatile and, therefore, very unpredictable. This simple truth is the basis of the reputation that cryptocurrencies have quickly earned from the investing public – crypto assets are the most volatile asset class in history. The industry is still in its infancy phase, many analysts will tell you, the reason for its incessantly wild price fluctuations, but this is only part of the explanation.
Miners create new coins based on token infrastructure rules, which can put limits on supply. Unless miners have short-term cash flow needs, most of these firms will hold onto their coins for the long haul. Tradable coins, which represent liquidity in the market, are in controlled supply. Event risk, as academics might describe it, can then wreak havoc, whether north or south. Good news could result in an upward spike of 10% or more in a single day, and the same is true if negative press hits the airways. If multiple items hit on the same day, then you will have a very bumpy ride for the duration.
What about the concept of “fair value”? In the stock world, we are familiar with several simple valuation methods that determine the present value of future earning streams by discounting them in some acceptable way. Another method may be to take a multiple of revenue to arrive at market capitalization, then to divide by outstanding shares. As an example, the former method, when applied to IBM, would start with a PE of 7.61. For the sector and type, you might multiply this figure by 15 to yield $114.15. The price today was $111.39, a bit below this “fair price” estimation.
Do such valuation methods exist for Bitcoin? Analysts would quickly say that the industry is too young for traditional technical methods to yield anything reliable at this stage. Besides this fact, Bitcoin does not have an “earnings stream”, so to speak. Its value has been determined specifically by supply and demand demographics in the marketplace, which are in their infancy, as far as access and egress methods are concerned. Prices are so sensitive to the slightest stimulus in the market that valuation models simply do not work. It would be incorrect to expect otherwise.
Hans Hauge is one analyst that is undeterred by this previous argument. He has investigated several methods and says: “The problem with using a long-term valuation approach to Bitcoin is that you only have a clear direction when the market has made a severe mistake. If the market has priced Bitcoin too low, it’s a great time to buy; if it’s too high, maybe you should move some of that into cash or another asset class. However, when the models say the price is fair, or when they contradict each other, what do you do?” In other words, “fair price” may only be a guide and a questionable one at that.
Mr. Hauge postulates that asset bubbles can give us valuable clues. When one forms, as it did a year ago for BTC, one can assume that you have risen well past “fair value”, but also that you have also passed it on the way down. Like it or not, Bitcoin and its altcoin brethren still have a very large psychological component that has an equally large impact on pricing behavior. It may take years for this phenomenon to dissipate. Until then, we will have to accept that any valuation model, even the best ones, will appear crude and rudimentary.
Mr. Hauge has also reviewed several models and monitored their success of failure, if you will, to give reasonable results. He actually categorizes his various models as either “Bulls” or “Bears”. Today, we will look at two of his favorites, one from each category.
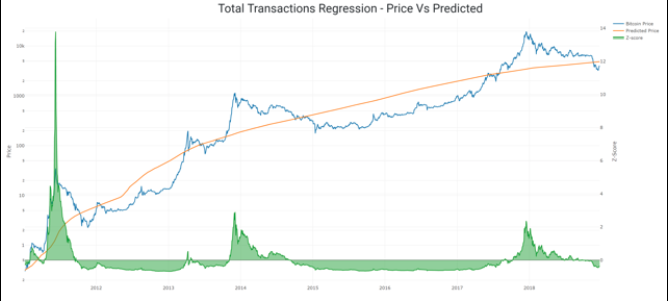
This author, along with others that are chart-focused, have chosen to use logarithmic values on the Price axis for Bitcoin and other cryptos, a necessity due again to the infancy of the asset class. As time wears on, we should be able to use standard versions, but, under this assumption, trends tend to appear visually for the time being. The “Blue” line represents BTC values over time, while the “Orange” line details the prices predicted by the model. Z-scores, a statistical tool that reflect standard deviations from the mean, are also provided for reference purposes.
The author posits that total transactions on the Bitcoin network represent a key data point over the lifetime of BTC, and he contends that, “Total transactions are an interesting proxy for the age of Bitcoin.” As of December 23rd, his proprietary model yields a value of $4,860 for Bitcoin, versus an actual figure of $4,027.
In the author’s words: “Using this model, Bitcoin’s price does come in under what’s expected. However, in the past, this state (where the price is below expected) has persisted for many months or even years. So, maybe it’s a good time to buy, but there doesn’t seem to be any reason to rush in at this point. If this period of undervaluation continues, then there will be plenty of time to take a position when (or if) it’s right for you.” Are you convinced? Every buyer and seller must make up their own mind.
In this case, Mr. Hauge reverts to tracking daily transactions to arrive at a value of the activity on the network, a central theme in many of the methods that he discusses. In his own words: “The daily transaction count tells the network story from the point of view of the activity of the network. From the point of view of network valuation, it appears that the price of Bitcoin is still too high.” That would be true, if you accept the $2,302 value delivered by this model, versus that market value once more of $4,027. The chart for this valuation method is presented below:
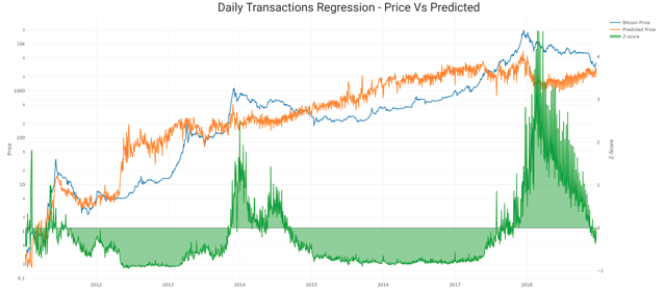
The validity of this model is suspect, if only one were to consider the wild fluctuations of the various Z-scores over 2018. Mathematical models do not seem to react very well went asset bubbles burst. Extreme events tend to destroy any attempt at cogent technical analysis applications.
As Mr. Hauge notes, both of these models have common ground in the period covering 2015 through 2017. Both show that Bitcoin may have been undervalued, a good time to buy, so to speak. When Bitcoin rose at asymptotic rates near the end of 2017, alarm bells were sounding in both cases.
Mr. Hauge believes the time will come when both models will reflect common truths once more: “I think when we hit the actual price bottom of this current market, we’ll see that same signal cohesion. In other words, the charts will agree. Until then, there’s going to be a lot of noise and confusion.”
Until that time comes, be careful and cautious with accepting any predictions from technical models in the crypto space. There will be many “siren calls” from salesmen touting the latest and greatest model known to man that delivers perfect “Buy/Sell” signals for all cryptiocurrencies. You, too, can now be skeptical. Caveat Emptor!