 Trading signals are often spread across charts while a stock’s price continues in a steady trend. This indicates a difference in the indicators and price action as they are not moving proportionally, which in turn is an immediate signal of trouble. Although this might seem like incorrect signalling, it is actually one of the greatest trading signals found in commodity, stock and forex trading. It is a signal of a forthcoming reversal in trend, which can be used to your advantage in plotting trades.
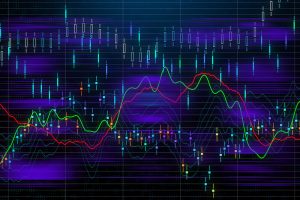
Bullish and bearish divergence
There are two types of divergence. The first is the bullish pattern signal, which can be found when the price action is moving downward and the indicators are revealing higher low points. This should prompt a trader to place long positions where possible. The second type is the bearish divergence, which is seen by an increasing price action trend with the indicator reflecting lower highs. In this instance, a trader should look for potential short positions.
Indicators used to recognize divergence
Here is a look at three of the indicators that signal divergence.
MACD, which stands for the Moving Average Convergence Divergence, is seen as two lines – a faster one and a slower one – that come across each other, along with the zero line. If you are using this indicator, your key signal will be the moment the faster line breaks through the lower line. You will have a bullish divergence if the fast line crosses above the slow line and a bearish divergence if the line crosses below the slow line. A bearish signal will be seen if the price action is moving up and the MACD line is moving down. Alternately, a bullish signal is present if the price action is moving down and the MACD line is moving up.
RSI, or the Relative Strength Index, is an indicator seen by one line with three fluctuations in different areas. It is a type of oscillator indicator. These areas include the oversold area below 30, the overbought area above 70, and the neutral area between oversold and overbought. You will find a sell signal if the RSI line goes above 70 into the overbought area. Conversely, a buy signal is found when the line goes below 30 into the oversold area.
This indicator, like the RSI indicator, is part of the oscillator indicator group. This indicator is seen when two lines fluctuate throughout the areas on the chart between 0 and 100. The oversold area is below 20, the overbought area is above 80, and the zone between these two areas is the neutral area. A sell signal is seen when the two lines reach the overbought area above 80, while a buy signal is seen when the lines reach the oversold area below 20.
A divergence is therefore present when the price action and the stochastic line are moving in contradicting directions. A bearish divergence is present when the price action increases and the stochastic line decreases, and a bullish divergence is present when the price action decreases while the stochastic line is increasing.
Trading a divergence
To trade according to divergence, you can use one of several key trading strategies. The best way to trade from divergence is to first monitor the price action on the chart carefully to be sure of the divergence of indicators. Your signal to enter your trade is when the price action breaks its trend line or breaks the support or resistance lines.
In order to maintain a level of security, stop losses are essential when using this trading method. Your stop losses should be placed either above the top or below the bottom. In addition, you can plot your profit target either along the trend line or where the price reaches higher lows or lower highs.