 Using the Fibonacci theory in forex trading is common for improving positions, both short and long-term. The theory is used in the analysis of price levels and how they show support and resistance. Fibonacci forms part of a highly technical analytical process that traders use to create strategies, monitoring the changes and volatility of the market.
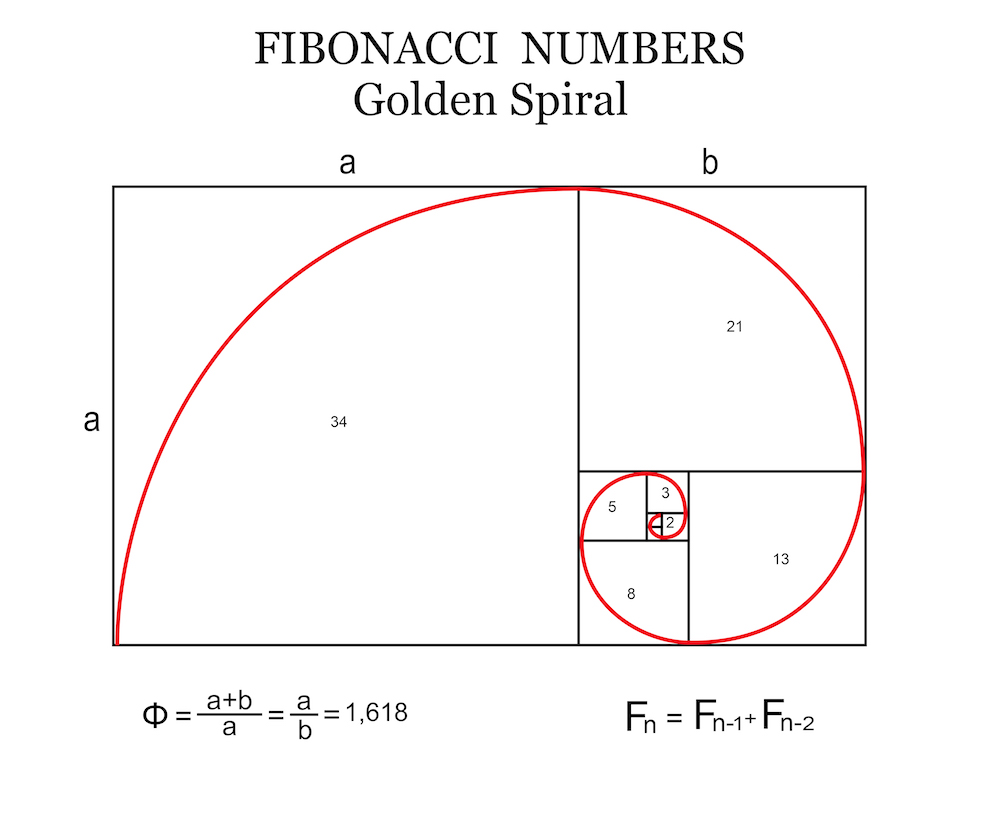
Fibonacci is a theory created by a monk and mathematician named Leonardo de Pisa in the twelfth century. It is based on the discovery of a theoretical and numerical sequence that has been recognized in nature and classic artworks. Helpfully, the sequence can also be utilized to describe relationships in today’s financial markets. Fibonacci has even been proven to reflect price trends. The primary Fibonacci structure is comprised of .386, .50 and .618 retracement levels, and .214 and .786 levels for in-depth market analysis. Since the 1990s, these secondary ratios have seen a rise in importance because of the change in the technical funds analysis used by traders. There have been many whipsaws in primary Fibonacci levels, but the harmonic structures still remain.
Fibonacci’s two categories
The applications of the Fibonacci can be divided into two categories. The first is historical analysis, which monitors long-term forex trends and notes what factors instigate changes in the market. The aim of the analysis is to gather information to use in the second category, which is trade preparation. The impact is seen in short-term pricing when observing long-term historical analysis, especially since currency pairs change often. Historical analysis is an essential part of trading strategies to compare bond and stock trends, as they may repeat themselves over time. This can be done by zooming out on weekly or monthly charts, placing a grid of secular bull and bear markets, and monitored until a price action goes above or below the long-term averages.
Once this is done, you can continue with the second category: trade preparation. This can be done by placing a grid over a daily analysis chart’s longest trend and marking the turning points. In order to track the time frame during which this occurs, smaller grids can then be placed at shorter time intervals to point out convergence between the harmonic levels.
Fibonacci works well in day trading because daily and weekly trends tend to repeat similar patterns. In order to access these hidden numbers, stretch a grid over trends of 15 and 60 minute intervals. By adding the daily levels before the weekly levels, you will be able to pinpoint the turning points in the 24 hour forex day. The grids usually work best when placed across major highs or lows to focus on the second wave of a trend.
Relationship with other indicators
The ability of retracement levels to stabilize prices and increase profits is directly related to the amount of technical elements (such as Fibonacci retracements, moving averages, strength indicators and gaps) that are converging at a certain level. For example, a forex pair has a high chance it will reverse if many grids align with two different retracements of two different trends. If you were then to add a 200-bar moving average, the chances would be even greater. This can also be applied to exit strategies, whereby a trader should know to take his/her profits when the price is at a certain retracement level with various alignments.
The key benefit of long-term Fibonacci grids are seen when added to currency pairs and monitored as they reach common retracement levels. Short-term grids are more beneficial when used in daily trade preparation. If you want to increase the chance of profitable counter swings, add other indicators and look for the noteworthy convergences.