We have continually stressed that to be a successful trader, it is paramount that you have a step-by-step plan that insulates your decision-making process from your innate emotions. The heat of the trade can bring out the worst in us, causing us to cut your winners off early and allowing our losers to run, exactly the opposite path that needs to be followed. We have yet to discuss how to develop such an initial plan. The best advice from veteran traders is the old adage – “Keep it simple, stupid!” Your plan does not need to be complex or cluttered with too much information, in fact, the less, the better.
Beginners may also want to start slow, perhaps, emulating the style of a “Swing Trader”, where you look for meaningful trends with positions that might be open for a few days at a time. Once you have a starting point, you will want to practice your plan on a demo system for hours, days if possible, to fine tune the process and to get your mind used to follow a disciplined, rather than intuitive, approach to the market. The elements that you will want to include in this “roadmap” will be rules that answer these questions:
Where to look and what constitutes a trading signal?
When to get into the market?
When to exit the market at either a profit or a loss?
How do you protect your position from a risk of loss?
Books have been written on this topic, and there is a multitude of plans on the Internet, but, for the sake of example, we have chosen a straightforward initial setup:
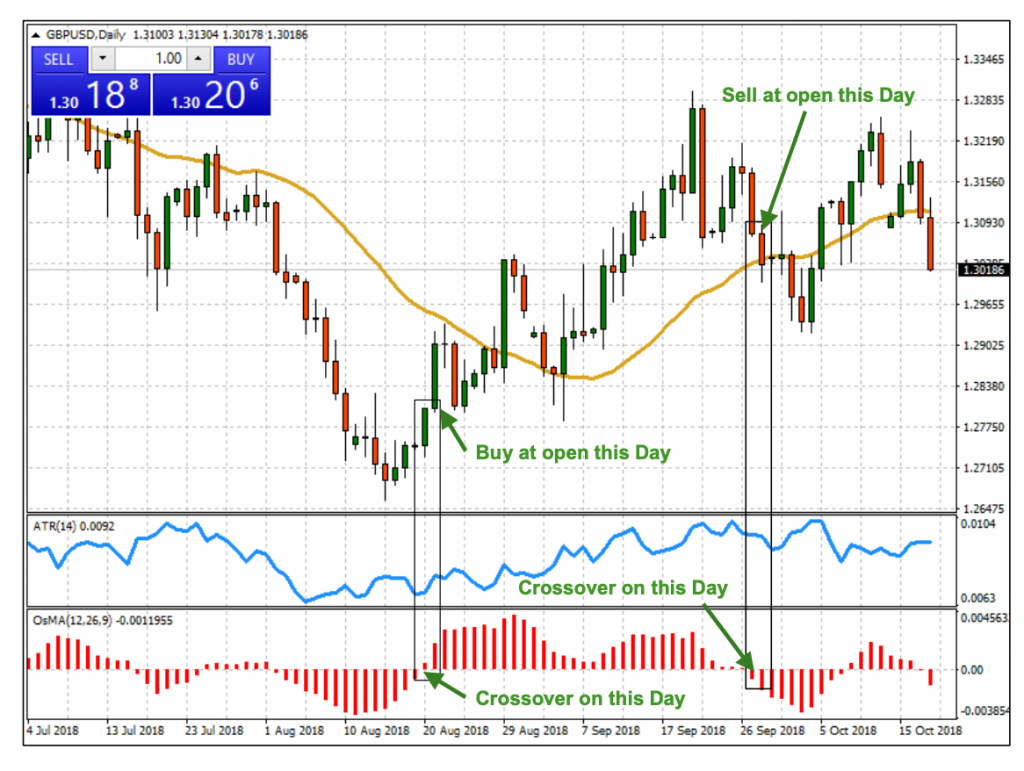
Before we get to the “rules”, you will need to adapt your trading platform parameters to the match the diagram above:
Your trading rules are then as follows:
You enter the market, a BUY, when the OsMA red bars reverse, but only after the period candlestick is completely formed – enter the trade as soon as the next new candle is beginning to form or open;
You set a stop loss order at 70% of the ATR value below your entry value (in this example, the Stop/Loss would be set at about 50 basis points or pips below entry);
You exit the market, a SELL when the OsMA red bars reverse again, but only after the period candlestick is completely formed – enter the trade as soon as the next new candle is beginning to form or open.
You now have an initial trading plan. It is now time to practice, practice, practice on your demo system until you feel comfortable with it. Feel free to modify this one as you gain more experience (Many traders like Bollinger Bands on their chart, a homework assignment for you). As noted on the chart above, this strategy would have generated a Buy signal, denoted by the “boxed” area on the left, and a SELL signal, as denoted by the “boxed” area on the right, yielding a healthy gain of 250 pips.
In this example, the strategy worked very well, but markets are fickle. They can change very quickly, and indicators may not give a correct signal. They are not perfect. Past results are never a guarantee of future performance. Over time, develop more strategies, but test each before using. Remember — Experience will lead to confidence, and confidence, to good judgment.